Exploring the power of location, with ESRI UK
7th January 2026
Stephen Croney,
Esri UK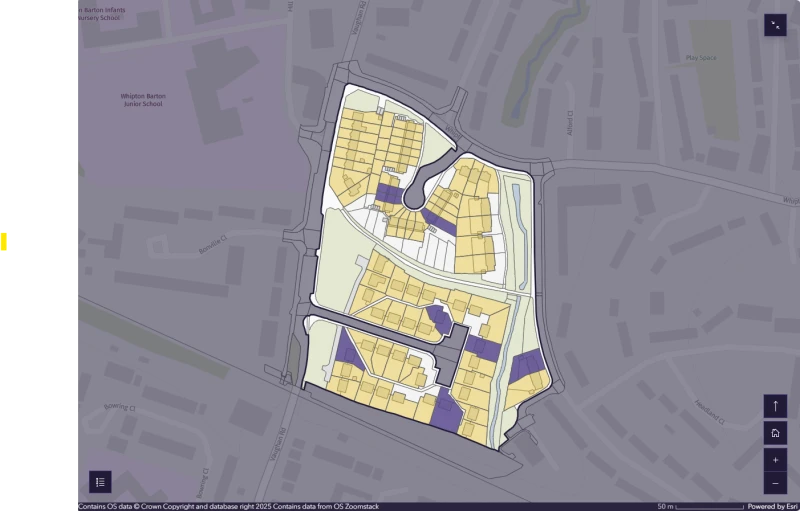
Transforming housing, health and climate resilience with geography
The power of place within housing can be transformative. Every home, community and green space is connected to a location, and many housing providers are discovering the incredible value that can be unlocked when they start looking at their data through the lens of geography.
Geographic Information Systems (GIS) capture, store, analyse, manage and visualise data linked to location. GIS connects data to maps, allowing you to see patterns, relationships and trends that aren’t immediately obvious when data is spread across different spreadsheets and siloed management systems. This location-driven insight is revolutionising processes for housing associations of all sizes.
Seeing what you own and where it is
One of the biggest challenges for housing associations is understanding exactly what they own and where it is. From housing stock and garages to shared verges and green spaces, assets are often managed across multiple systems that don’t talk to each other, leading to inefficiencies and missed opportunities for joined up maintenance.
GIS makes location the golden thread that links data across departments. Using identifiers such as Unique Property Reference Numbers (UPRNs), organisations can ‘geo-enable’ their data, connecting property, maintenance and community data in one place. Visualising this on a map provides a single, shared source of truth that supports smarter planning, fewer errors and lower costs.
Thirteen Group in the North East shows this golden thread in action. Managing over 35,000 homes, they use GIS to bring together information from multiple systems. Mapping housing stock, community data and local services shows where investment is needed and where housing demand is highest, improving community outcomes by simply connecting data through place.
Spotting trends and making changes
Many housing providers are data-rich but insight-poor. GIS acts as a data integrator, bringing together housing, health, environmental and demographic data to reveal the bigger picture. Teams can then quickly spot trends, prevent problems before they occur and make better informed decisions, identifying properties most at risk of damp and mould, or seeing clusters of anti-social behaviour or areas of fuel poverty.
By breaking down data silos, GIS transforms disconnected information into actionable intelligence. This helps providers move from reactive to proactive decision-making and prioritise interventions that make the greatest difference to residents.
Collaboration in action – SHINE’s OneMap
The Social Housing Innovation North East (SHINE) partnership shows the power of GIS in practice. Seventeen housing associations across the region have joined forces to tackle shared challenges, from maintenance to community wellbeing. Their project, OneMap, shows every property across all participating areas in a single web-based map. Layers can be added to the map, including demographics, anti-social behaviour, planned maintenance programmes and repair needs, so that through OneMap, SHINE associations can join up contracts, saving money, reducing duplication and increasing efficiency. With overlapping housing association boundaries and services, this approach offers an overview of the entire region, simplifying effective collaboration. With plans to integrate health and community data in the future, OneMap will also help to increase the understanding of environmental and health related factors within communities. This data-driven collaboration is reshaping the way housing associations operate in the North East, showing once again how the golden thread of location is key to unlocking efficiencies.
Building healthier homes and communities
At its heart, GIS is about improving lives, not just mapping assets. Viewing different datasets in one place helps housing providers build the right houses in the right places, and design healthier neighbourhoods that support wellbeing. Spatial analysis can identify areas prone to anti-social behaviour or with limited access to amenities, helping teams make more informed allocation decisions.
There’s also a clear link between location and healthy communities. Accessible green space encourages physical activity and social interaction, and geospatial insight can be used to create neighbourhoods that are better connected, where essential amenities like schools, shops and GPs are within a short walk, encouraging less car-dependence and leading to a better quality of life.
This all feeds into understanding and mitigating climate risks. By integrating third party data on flooding, heat exposure and environmental hazards, providers can assess which sites face the greatest risks before developing new housing, as well as guiding priorities for retrofitting, solar power installations or energy-efficiency upgrades. As climate patterns shift, housing providers can forecast where future heatwaves or flooding may occur and plan maintenance and investment, supporting long-term resilience.
Introducing the Healthy Homes Geospatial Hub
At ESRI UK, we’re excited to support the launch of the Healthy Homes Geospatial Hub, alongside Healthy Homes Hub and ODCGIS. This new platform will spotlight innovation, practical advice and best practice in GIS for housing, helping providers harness the power of data to make better decisions for healthier homes. The Healthy Homes Geospatial Hub will focus on key issues such as damp and mould, retrofitting and environmental planning, offering guidance on how GIS can help tackle the topics that matter the most.
Historically, barriers such as cost and a lack of skills, knowledge and data access have slowed GIS adoption, but that’s changing. Today’s cloud-based GIS tools are affordable and scalable, and it’s easy to start small, with a single simple project that you think will add value. You don’t even need a dedicated data science team, just curiosity and a willingness to explore your data through the lens of location.
GIS in action
Many housing providers are already seeing the benefit of using GIS. Sovereign Network Group is combining GIS with Power BI analytics to visualise wellbeing across communities in southern England. Merging spatial and analytical data, they can pinpoint areas where investment will have the greatest impact, whether that’s funding community programmes, improving housing quality or addressing social inequality.
Southern Housing, with over 78,000 homes, is using GIS to deliver its biodiversity and sustainability strategy. By mapping greenspaces and habitats, they can measure and report on their goal of supporting 30 flora and fauna species across 30 new or enhanced habitats by 2030.
Looking ahead
The heart of the housing sector has always been about people and place, and GIS gives us a clearer way to connect the two. Making sense of complex data allows organisations to uncover relationships between homes and health, investment and impact, communities and climate.
If you’ve yet to start your geospatial journey, my advice would be to start small and give yourself time and space to grow. Whether it’s mapping your assets, identifying homes most in need of maintenance or retrofit, or collaborating with neighbouring associations, every step takes you towards healthier, more efficient and resilient homes. If we can help you with taking that step, get in touch.
Unlock all content
This is the 1 of 3 articles you can access for free. Become a member to unlock unlimited access to our full content library.
Author