
GIS in Housing: From Maps to Meaningful Decisions
20th February 2026
Rick Thompson,
ODCGIS
Why Geographic Information Systems should be central to long-term planning, not a “nice to have”
If GIS is still seen in your organisation as “the mapping tool” or something that sits quietly with a single specialist, it’s time to pause and rethink.
Because when used properly, GIS is not about maps at all.
It’s about understanding homes in context: environmental, social, climatic and operational, and using that understanding to make better decisions, earlier.
Rick Thompson, Director of Operations at ODC GIS, has shared practical insight into how GIS is already being used across the sector and, more importantly, how it could be used far more effectively.
Why this matters now
Housing providers are under pressure from every direction:
Damp and mould responsibilities are rightly sharper
Climate risk is no longer theoretical
Retrofit decisions carry long-term consequences
ESG expectations are rising
Data quality is under scrutiny
Resources are stretched
Yet many organisations are still making strategic decisions without fully understanding the places their homes sit in. That is the gap GIS fills, when it is approached correctly.
A quick introduction
ODC GIS has been operating for over 32 years, supporting the housing sector throughout that time, covering over 1.2 million homes, roughly 25% of all UK social housing.
The biggest misconception about GIS in housing
One of the most important points made was:
GIS isn’t really about the software. It’s about the data.
You can own the best GIS platform available, but without the right data, and without connecting that data meaningfully, it will never deliver value.
Conversely, organisations that believe they “aren’t ready for GIS” often already hold 80% of what they need, they just haven’t connected it spatially.
This is why GIS should be seen as an approach, not a product.
Starting with the right foundations: Address data and UPRNs
One of the most under-used datasets in housing is Ordnance Survey AddressBase.
At its heart is the Unique Property Reference Number (UPRN), the single, consistent identifier used across the public sector to describe a property.
Why this matters:
Housing systems all store addresses slightly differently
Without UPRNs, data matching becomes unreliable
With UPRNs, datasets can be joined confidently
Once UPRNs are embedded, housing providers can accurately connect homes to:
EPC data
Indices of Multiple Deprivation
Health datasets
Environmental risk data
Retrofit and compliance information
For many organisations, this is the real starting point for effective GIS use.
Filling data gaps: The National Geographic Database (NGD)
Data quality issues are common in housing, particularly where stock transfers, mergers, acquisitions and disposals have occurred over time.
The National Geographic Database (NGD) from Ordnance Survey brings together multiple datasets into a single, consistent national view.
For housing providers, it can be used to:
Quality-assure existing asset data
Fill gaps in information such as:
Building age
Building type
Number of floors
Sense-check records that may be decades old
This matters because these attributes directly influence:
Investment planning
Retrofit pathways
Planned maintenance programmes
Risk prioritisation
Better decisions depend on better confidence in the data behind them.
Understanding what you actually own: Land Registry data
It sounds simple, but it’s often not.
Many housing providers do not have a complete, accurate picture of:
All the land they own
Land that has been disposed of but still appears on records
Small parcels that have been forgotten over time
Land Registry data provides a spatial view of ownership that allows organisations to:
Identify discrepancies
Clarify boundaries
Spot under-utilised land
Explore development opportunities
A simple analysis of property-to-land ratios can quickly highlight where land may not be working as hard as it could.
Climate risk is local, GIS makes it visible
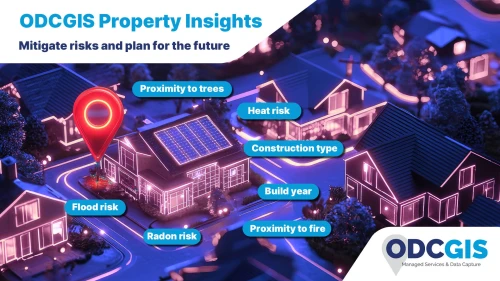
One of the most powerful uses of GIS is turning abstract climate risk into place-specific insight.
Heat risk: planning beyond winter
Much of retrofit thinking has focused, understandably, on cold homes. But homes in the UK were largely not designed for heat.
Using datasets such as HeatView from Map Impact, housing providers can begin to understand:
Which homes are most at risk of overheating
How surrounding environment influences temperature
Where retrofit decisions may unintentionally increase summer risk
When heat risk data is combined with:
Building age
Construction type
Tree canopy coverage
…patterns begin to emerge that cannot be seen in spreadsheets alone.
Flood, drought and wildfire risk
GIS allows housing providers to assess portfolio-wide exposure to:
Flood risk (using insurance-grade datasets such as those from Sweco)
Drought stress
Emerging wildfire risk
These are no longer distant concerns. They affect:
Insurance costs
Business continuity
Resident safety
Long-term viability of stock
Understanding risk spatially enables planned adaptation, not reactive response.
Biodiversity and land stewardship
Biodiversity Net Gain and environmental responsibility are increasingly part of housing providers’ remit.
GIS supports this by helping organisations:
Understand the land they manage today
Identify areas with biodiversity potential
Target improvements where they will have most impact
By combining habitat data with grounds maintenance information, housing providers can move from generic approaches to intentional land stewardship.
Trees, damp and mould: seeing the connections
A particularly practical example shared was the use of BlueSky’s National Tree Map.
This dataset provides:
Location of trees
Canopy size
Estimated height
When overlaid with housing stock, it enables analysis such as:
Properties with trees within two or three metres
Canopy overlap with roofs and gutters
Potential root-related structural risks
This insight supports proactive work on:
Damp and mould prevention
Guttering and drainage issues
Tree safety and maintenance planning
Again, GIS is not replacing professional judgement, it is directing attention where it matters most.
The bigger shift: from reactive to preventative housing management
The real opportunity with GIS is not any single dataset.
It is the shift it enables:
From reactive to preventative
From siloed teams to shared understanding
From static reports to living insight
Whether delivered through full GIS platforms or integrated into back-office systems, spatial intelligence allows housing providers to plan with confidence, not assumption.
Final thoughts
GIS is not about becoming more technical.
It is about becoming more informed.
When housing providers understand the place around their homes - the risks, the opportunities, the patterns, better decisions naturally follow.
The challenge is no longer whether GIS is relevant.
It’s whether organisations are ready to use it with intent.
And that starts with curiosity, not complexity.
Unlock all content
This is the 1 of 3 articles you can access for free. Become a member to unlock unlimited access to our full content library.
Author